
Seasonal traffic patterns across Europe in 2025
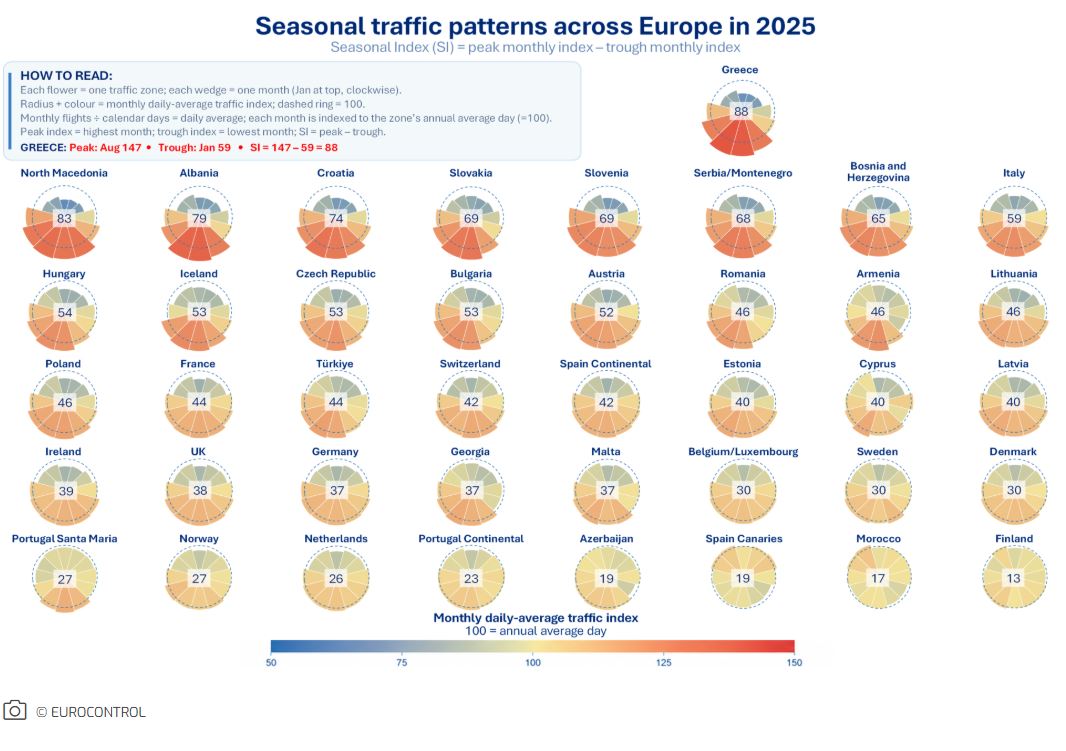
Across most of Europe, traffic follows a clear summer-oriented pattern, but the intensity of the seasonal swing differs substantially. Greece is the country with the largest gap between low winter traffic and very high summer traffic, resulting in a Seasonality Index (SI) of 88 (calculated as the difference between peak and trough traffic months). North Macedonia with an SI of 83 is just behind, with Albania and Croatia also displaying pronounced summer peaks (SIs of 79 and 74 respectively). Overall, many of the most seasonal traffic zones are found in the Balkans, including Slovenia, Serbia/Montenegro and Bosnia & Herzegovina. These markets share a strong concentration of leisure traffic during the summer period, resulting in a steep build-up towards July and August, followed by a marked decline outside the summer season.
At the other end of the spectrum, Finland is the most seasonally stable traffic zone in the analysis with an SI difference between peak and trough months of just 13 thanks to solid summer activity balanced by strong winter traffic, particularly to northern Finland and Lapland. The climate of the Canary Islands and Morocco also is reflected in balanced seasonal profiles leading to substantial year-round leisure demand.
The contrast between these traffic zones shows that while overall traffic has a clear summer spike, at country level the picture is much more nuanced. Strongly seasonal Balkan and Mediterranean markets face highly concentrated summer demand, while destinations with significant winter sports/tourism activity or winter sun show much smaller seasonal swings. For the EUROCONTROL Network Manager and individual air navigation service providers, understanding where and when these seasonal peaks occur is vital for anticipating capacity pressure and to see how traffic demand shifts geographically through the year.
Technical Bits: The analysis uses total flights by traffic zone in 2025. Monthly totals are converted to daily averages and indexed to each traffic zone’s 2025 reference level (=100). The Seasonality Index (SI) is the difference between the highest and lowest monthly indices; higher values indicate stronger seasonality. Other measures, such as peak-to-trough ratios or seasonal concentration, could also be used. The analysis could also be applied separately to arrivals/departures and overflights or extended across multiple years. Ukraine, Moldova and Israel are excluded.
View and download this Data Snapshot







.jpg)


.png)

Comments
There are no comments yet for this item
Join the discussion